We may earn a commission from links on this page, at no extra cost to you.
The rear screen lies. It looks bright in a dark room and washed out in sunlight, so a photo that looks fine on the screen can be badly exposed. The histogram does not lie. It is the most honest exposure tool your camera has, and it confirms what the light meter only guessed at.
What a histogram shows
The horizontal axis is brightness: pure black at the far left, mid-tones in the middle, pure white at the far right. The vertical axis is how many pixels sit at each level. A tall spike means many pixels of that brightness; a low area means few.
There is no single correct shape. A bright snowy scene leans right, a dark night scene leans left, and both can be correct. What you are watching for is data falling off the edges.
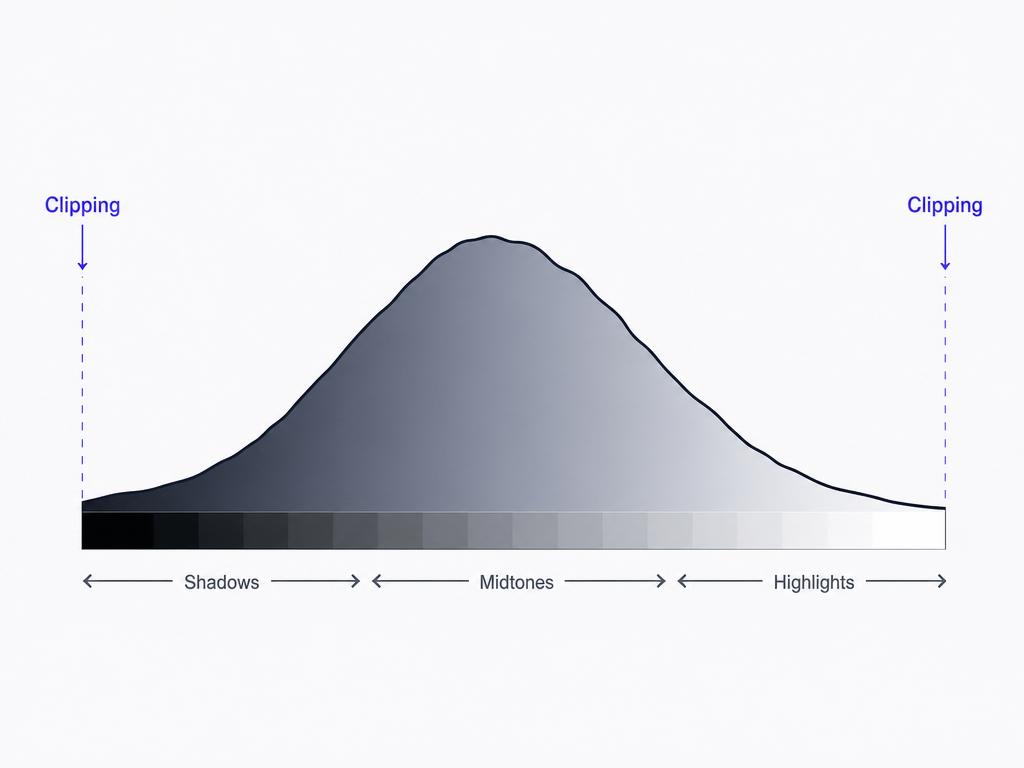
Reading the edges: clipping
Clipping is when tones get pushed past the edge of the graph and lose all detail.
- Left edge spike (shadow clipping): pixels are pure black with no recoverable detail. Some is normal in a dark scene; a tall wall against the left edge means you crushed the shadows.
- Right edge spike (highlight clipping): pixels are pure white with no detail. This is usually worse, because blown highlights cannot be recovered in editing. A bright sky often clips, but a clipped face is a mistake.
Many cameras also offer a blinking "blinkies" overlay that flashes the clipped areas directly on the image, which is faster to read at a glance than the graph itself.
Using it to fix exposure
When you see clipping you do not want, adjust and reshoot:
- Highlights clipped on the right? Reduce exposure. Drop the ISO, use a faster shutter speed, or dial in negative exposure compensation.
- Shadows clipped on the left? Add exposure. Open the aperture, slow the shutter, or add positive compensation.
- Both edges clipping at once? The scene's contrast is wider than the sensor can hold. Expose for the highlights and lift shadows later, or use a graduated filter or bracketing.
A balanced daylight starting point like f/8 · 1/250 · ISO 200 usually produces a histogram that sits comfortably inside both edges.
Common mistakes
- Judging exposure by the rear screen. Its brightness changes with ambient light. The histogram is consistent. Trust the graph.
- Aiming for a centered bell curve every time. There is no ideal shape. A low-key portrait should lean left; a high-key one should lean right.
- Ignoring highlight clipping because the screen looked fine. Blown highlights are gone for good. Catch them on the histogram before you leave the scene.
- Watching only the combined histogram. A single color channel can clip while the overall graph looks safe, which shows up as color shifts in skies and skin. Switch to the RGB histogram for critical work.
This is the verification step for every other control in the exposure triangle, and the exposure calculator helps you predict which way to adjust before you check.
What does a good histogram look like?
There is no universal good shape. A correct histogram is one where the important tones are not clipped against either edge. Bright scenes lean right, dark scenes lean left, and both can be exposed correctly.
Is it better to clip shadows or highlights?
Clip shadows before highlights when you must choose. Shadow detail is often recoverable in editing, while blown highlights are usually gone for good. This is why many photographers expose to protect the right side of the graph.
Should I check the histogram on every shot?
Not every frame, but check it whenever the light changes or the scene is high contrast. In tricky light, the histogram catches exposure errors that the rear screen hides.
Related Learn guides
Aperture Priority vs Shutter Priority: Which to Use
Aperture priority lets you control depth of field; shutter priority lets you control motion. Here is what each mode locks, what it leaves to the camera, and when to pick which.
Read guide
Autofocus Modes Explained: Single, Continuous, and Auto
Single autofocus locks on still subjects; continuous tracks moving ones. Here is what AF-S, AF-C, and the focus area modes do, and which to pick for your shot.
Read guide
Back Button Focus Explained: What It Is and Why to Use It
Back button focus moves focusing off the shutter button onto a rear button, so the shutter only takes the photo. Here is what it does and how to set it up.
Read guide
Backlight and Silhouettes: Shooting Into the Light
When the light is behind your subject, it either glows or goes black. Here is how to control which one you get.
Read guideResearched, not personally tested: picks come from specs, verified-owner reviews, and expert sources, scored into the Aperture Score. As an Amazon Associate I earn from qualifying purchases. We may earn a commission from links here, at no extra cost to you. How we research →